


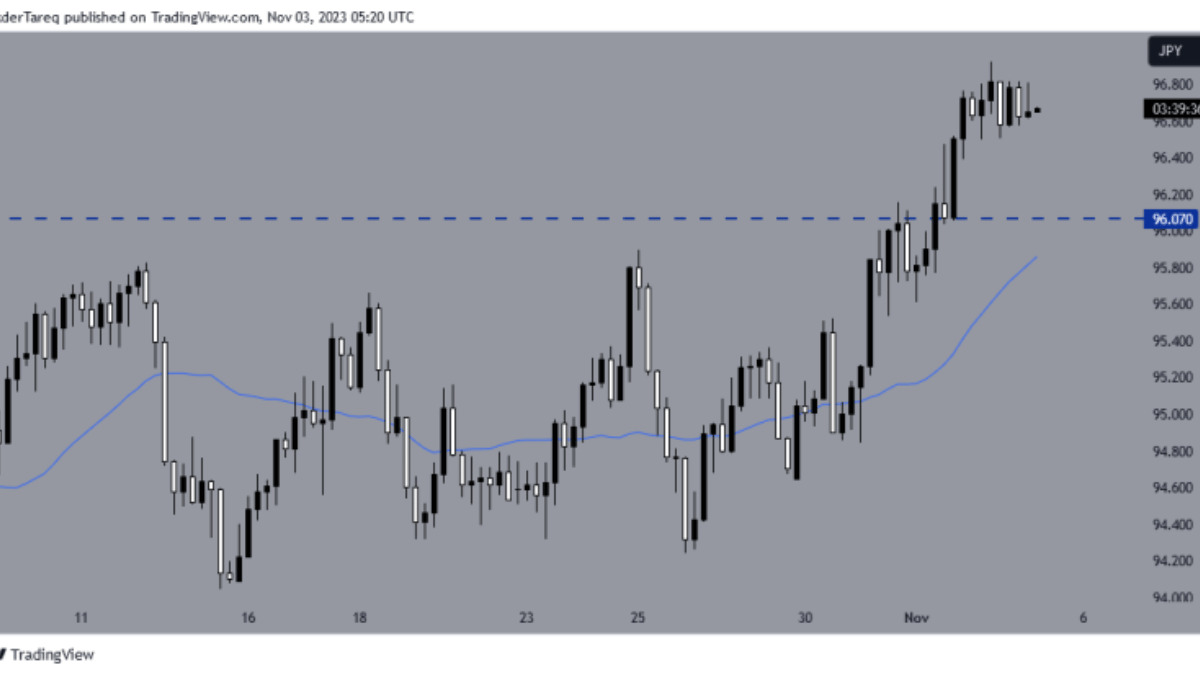
The H4 chart reveals a substantial upward trend in AUD/JPY, marked by a strong bullish trajectory. During this ascent, the pair successfully broke through the 30-period Simple Moving Average (SMA), and currently, it continues to trade comfortably above the SMA 30 support level. However, there are signs that the pair may be overbought, resulting in a phase of consolidation. The consolidation phase appears to be encountering formidable resistance. This situation hints at the possibility of a notable bearish correction. For potential buyers, a critical price level to watch is around 96.070, as it could play a pivotal role in determining the pair’s next direction.
Conversely, if the price manages to breach the resistance within the consolidation phase, it could trigger a northward movement, with the next resistance level anticipated around 97.550.
Subheading: Price Action Analysis – H1 Chart
Examining the H1 chart, we observe the pair’s price action has been oscillating around the 96.560 mark. This level has consistently acted as a support zone, leading to multiple bounces. A bearish breakout at this crucial support could attract sellers to consider short positions. In such a scenario, the price may find support around 96.000.


