


The EUR/USD currency pair is currently engaged in an intense battle between the bulls and the bears. On the H4 chart, several key technical factors are influencing its movement.
The pair experienced significant choppiness on the H4 chart, with two notable bounces occurring at a horizontal support level. Additionally, the Simple Moving Average (SMA) 30 has played a role as a resistance.
The H1 chart is still seeking a clear direction, and multiple technical levels are in play.
H4 Chart Analysis
The H4 chart reflects that the pair recently consolidated around 1.00650 before producing a bullish engulfing candle, signaling a potential bullish move. However, it has faced resistance from the SMA 30.
If the price manages to breach the SMA 30, it could attract buyers looking for long positions. This would require confirmation of a breakout followed by a bullish reversal pattern. The next resistance level to watch for is around 1.07500.
Conversely, if the price forms a bearish reversal pattern at the SMA 30, sellers might consider short positions below 1.00650. In such a scenario, the pair could find support near 1.06000.
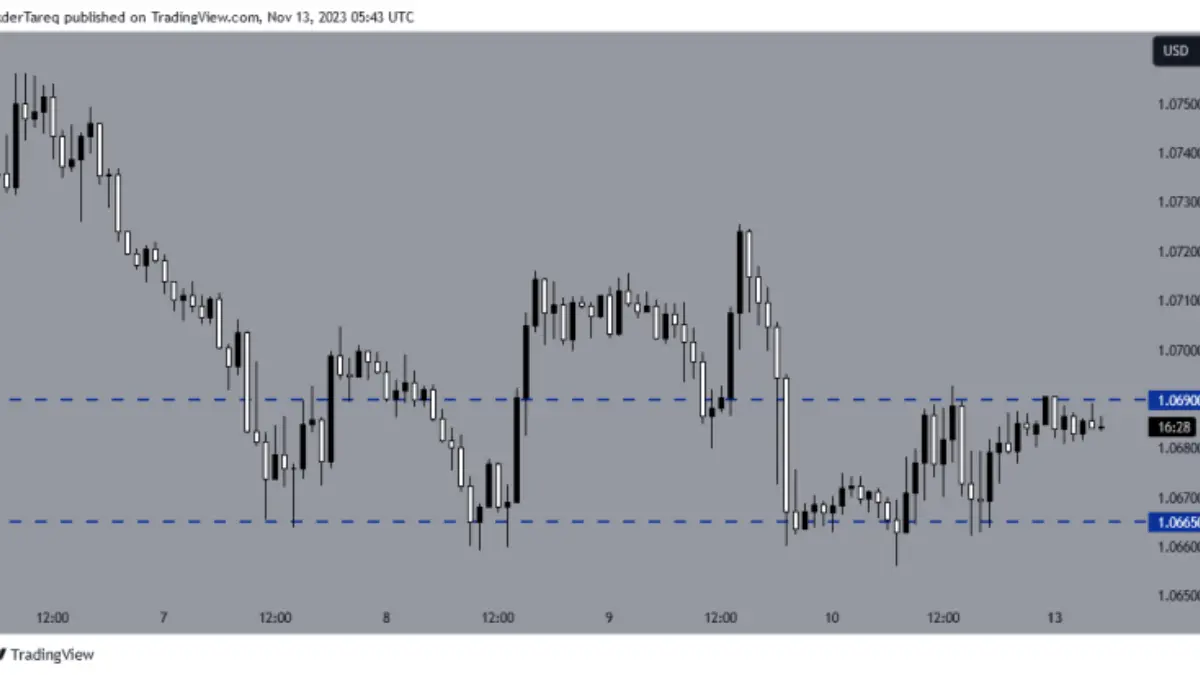
H1 Chart – Price Action Analysis
On the H1 chart, the pair is currently trading around 1.06900, which has been a strong resistance level. To identify potential long opportunities, buyers will need to wait for a price breakout above this level. A confirmed breakout may propel the price northward with strong momentum, possibly targeting the next resistance around 1.07150.
However, a strong bearish reversal candle could drive the price back south. In this case, sellers may target a profit-taking level near 1.06650. A bearish breakout may further enhance bearish momentum, pushing the price lower towards potential support around 1.06250.
The EUR/USD pair is currently at a critical juncture, and traders are closely monitoring these technical levels to determine the next direction in this intense battle between the bulls and the bears.


